
See who read your document
View analytics show you who opened a document you shared, when they opened it, and how far they read, from real view records. Click any document to open its detail page. That page is where you manage the file, share links, read the insights, and track people. From the moment you send a link, everything lands here: whether it was opened, which pages held attention, repeat visits, referrers, and the contact details people left.
This guide calls the people who open your document viewers. Some labels in the English dashboard still use older wording, so here is the mapping:
Guide term On-screen label (English dashboard)Viewers tab VisitorsRecipients sub-tab Dedicated link visitorsAll viewers section All visitorsViewers metric card VisitorsSame viewer toggle Same visitorLoad error "Couldn't load visitors." / Try againSearch box Search name, email, or fieldTabs on the document detail page
Section titled “Tabs on the document detail page”Open a document and you get four tabs: Content, Share links, Insights, and Viewers.
View data lives in two of these tabs: Insights and Viewers.
| Tab | What it does |
|---|---|
| Content | Add videos and links, swap in a new version, preview pages. No view data here. |
| Share links | Create links for each purpose and manage per-link share settings. |
| Insights | Document-wide metrics, filters, and charts. The all-viewers list sits at the bottom. |
| Viewers | Per-person lists. Three sub-tabs: Contacts, Recipients, Interest changes. |
Header buttons — Preview, Publish, Copy share link, Bookmark, More
Section titled “Header buttons — Preview, Publish, Copy share link, Bookmark, More”These sit at the top of the detail page, above the tabs.
- Preview opens the document in a new tab through the web viewer, using a personal link tied to your account. It mirrors the quick link you set, so a lead capture quick link shows the form gate in the preview too. It also shows changes you haven’t published yet.
- Publish appears next to Preview, only while changes are waiting, in the spot where Copy share link usually sits. A new or restored version, a motion editor save, and a title change reach your shared links only after you click it. One click sends them all, you see Published to the shared link, and Copy share link comes back. Only people who can edit the document see it. See Update a document.
- Copy share link and ▾ are always there. Copy share link copies your quick link (the button reads Copied for a moment). With no quick link set, it opens Share links instead. The ▾ next to it opens the same Share links menu: copy any link directly, switch your quick link with the pin, or go to the Share links tab with Manage share links. New documents start with the Lead capture link as the quick link. While changes are waiting to be published, Publish takes this spot and the button returns after you publish. See Quick links.
- Bookmark adds or removes the document from your sidebar bookmarks.
- Add tag tags the document from under its title, up to 20 characters.
- More (⋮) opens Share, Edit, Duplicate, Move, and Delete.
Content tab — add videos and links, swap versions
Section titled “Content tab — add videos and links, swap versions”The Content tab manages the file itself. Its own subtitle reads “Add videos and links or swap in a new version — your shared link stays the same.” There is no view data here, so go to Insights or Viewers for that.
- Click the Manage versions card to open the version list, where you upload a new version or manage older ones. The small
ver.line on the card is the current version, and the card reads “Your shared link stays the same — just swap in the new version.” Links you already shared keep working, so you never resend them — click Publish to show them the new version. See Update a document. - Add video or link goes to the editor, where you layer videos, scheduled links, and embeds onto pages. Its card reads “Add YouTube, Google Sheets, links and more right on the page.” See Add motion effects.
- Page Previews scrolls pages horizontally; click one to enlarge it.
- Source file appears for documents uploaded from PowerPoint, Figma, or Express, and downloads the original.
Share links tab — create the right link for each purpose
Section titled “Share links tab — create the right link for each purpose”The Share links tab subtitle reads “Share the right link for each purpose. Check views link by link.” The list runs Quick link (when you set one) → All links (the four link types) → Integrations. Create per-recipient links with Add link on the right of All links. Hover over a recipient row and click the pencil to rename it — the new name also shows on the Insights Viewers card, in viewer details, and in the viewer CSV.
| Link | What the viewer gets |
|---|---|
| Open-access link | Anyone can open the document right away, with no information required. |
| Lead capture link | Only people who submit their name, email, or other details can open it. It works on every document — until you change the form, viewers get the default form that asks for an email. |
| Public web link | A public link you post on a site or blog so AI search can surface it. One per document, and no form can be attached. |
| Per-recipient links | One link per recipient. Starter 3, Pro 10, Business and Enterprise unlimited. |
| Integrations: Form integration | Connects details collected on your own form to this document’s view data. Business and above. |
Click share settings on a link row to open the share settings dialog titled with the link’s name (for example “Investor A Share Settings”). Every setting is stored per link.
| Setting | Scope |
|---|---|
| Viewer Type (For Presentation / For Report) | Per link |
| Lead form settings › Open | Per document, shown on the lead capture link only |
| Communication and Channel to show for this document | Per link |
| PDF Download | Per link, Pro and above |
| View Notification | Per link |
| Viewing Period Settings (7 days, 1 month, or a date) | Per link, Pro and above |
| Email allow list | That link only, never inherited |
| Password | That link only, never inherited |
| Disable this link now | Blocks that one link and leaves the others alone |
| Link deletion | Per-recipient links only; the other links are issued automatically |
| Disable this document’s link now | Bottom of the dialog, blocks every link on the document |
For the full walkthrough see Share with a link, and for building a form see Set up a lead form.
Views vs. viewers vs. stay time — what each number counts
Section titled “Views vs. viewers vs. stay time — what each number counts”These three trip people up most often. Views count openings, the viewer count counts people, and stay time measures one reading session. If one person opens the document three times, Views is 3 and the viewer count is 1.
| Metric | Counted per | One person opening 3 times |
|---|---|---|
| Views | Each view (session) | 3 |
| Viewers | Each person | 1 |
| Average Stay Time | Average across views | Average of all 3 |
| Average Completion | Average across views | Average of all 3 |
| Revisit Ratio | Share of people who opened more than once | Counted as a revisitor |
Stay time appears as mm:ss, and the stay time cell is that person’s cumulative total. While someone is still reading, a Viewing badge replaces their interest grade. The final grade appears once they finish.
Insights tab — document-wide performance
Section titled “Insights tab — document-wide performance”The Insights tab opens with a filter bar, then five metric cards. Next come Page Statistics and Top pages insights, then the four Devices, Sources, region, and top-viewer cards. The all-viewers list is at the very bottom.

The five metric cards
Section titled “The five metric cards”| Metric | Meaning |
|---|---|
| Views | How many times the document was opened in the period. |
| Viewers | How many distinct people opened it, using the same-viewer grouping. |
| Average Completion | How much of the document people read on average, pages read divided by total pages. |
| Revisit Ratio | Share of people who opened the document more than once. |
| Average Stay Time | Average time spent per opening, as mm:ss. |
Views, Visitors, and Revisit Ratio carry an ⓘ next to the label; hover it to see how that card counts. Average Completion and Average Stay Time have none. If the data fails to load, a grey — takes the place of the number and hovering it explains that it couldn’t load.
Page Statistics
Section titled “Page Statistics”Page Statistics charts how much of each page people read. Its subtitle reads “Detailed page statistics for all visitors”, and the segmented control above the chart switches between Average Stay Time and Views.
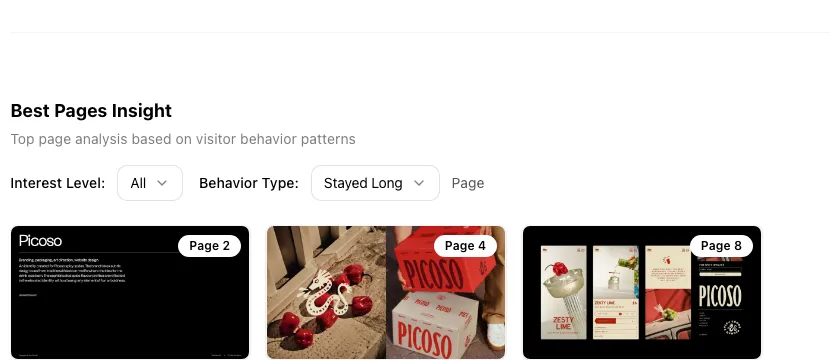
Top pages insights
Section titled “Top pages insights”Top pages insights shows which pages held attention longest and where people dropped off. Narrow it by interest grade and by behavior type.
Environment and referrer cards
Section titled “Environment and referrer cards”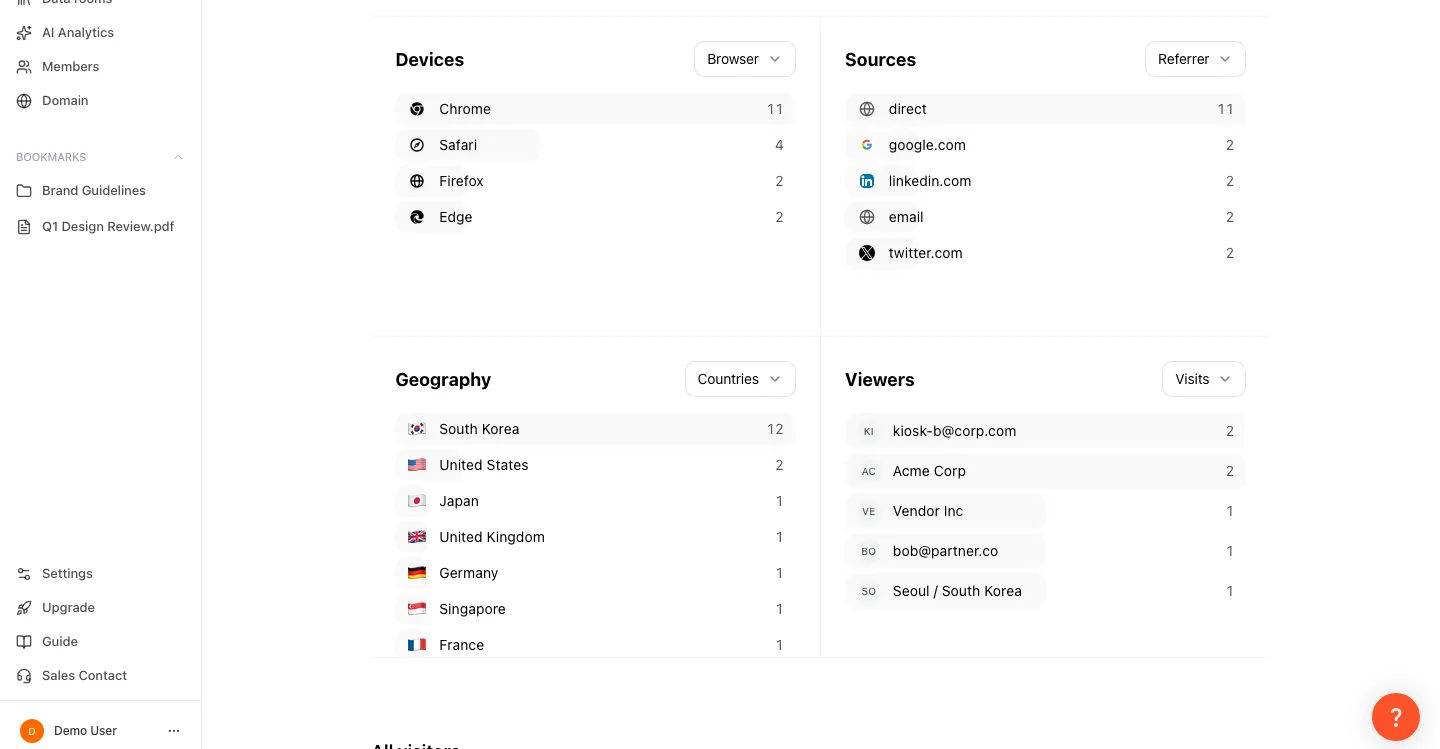
The Devices card switches between Device, Browser, and OS. The region card switches between Countries and Cities. The Sources card rolls values up by domain, buckets empty values under a lowercase direct, and its dropdown switches the axis between Referrer, utm_source, utm_medium, utm_campaign, utm_content, and utm_term. The last card ranks the people with the most views.
The all-viewers list is at the bottom of the Insights tab
Section titled “The all-viewers list is at the bottom of the Insights tab”That list is no longer a sub-tab under Viewers. It is the last section of the Insights tab, and the filters above it apply to it. So it answers “who matches these conditions?” directly. To see everyone with no conditions, use the tab link in that section’s subtitle.
Insight filters — period, sharer, version, share link, referrer, device, OS, browser, country, parameter
Section titled “Insight filters — period, sharer, version, share link, referrer, device, OS, browser, country, parameter”You can filter on ten axes. The period defaults to All when you arrive.
| Axis | Values |
|---|---|
| Period | Last 7 Days, Last 30 Days, All, plus Custom range |
| Sharer | Only data from links a specific member shared — shown to the owner and to editors only |
| Version | Only data for one version |
| Share Link | Only the links that exist on this document |
| Referrer | Which site people came from; no value reads Direct |
| Device, OS, Browser, Country | Access environment |
| Parameter | Query parameter names and values you attached to a link, such as utm tags (last row of the panel) |
Open the filter panel
Click All filters in the filter bar. Period, Sharer, and Version change straight from the bar, and Refresh reloads the latest data.
Pick your conditions
Select values on the axes you care about. Combining axes keeps only the views that match all of them.
Undo when you need to
Click Reset Filters inside the panel. With nothing to undo the button dims and reads “No filters to reset”.
Viewers tab — Contacts, Recipients, Interest changes
Section titled “Viewers tab — Contacts, Recipients, Interest changes”The Viewers tab lists people, not sessions. It has three sub-tabs and opens on Contacts. Contacts and Recipients always show a count; Interest changes shows a number only when there are changes, and that number turns into a blue badge while any of them are unreviewed.
| Sub-tab | Who is in it | Deep link |
|---|---|---|
| Contacts (default) | People who submitted details through the lead form or an external form | ?tab=leadform&vtab=leads |
| Recipients | People identified by a per-recipient link | ?tab=leadform&vtab=subLink |
| Interest changes | People whose interest grade changed recently | ?tab=leadform&vtab=changes |
Column order
Section titled “Column order”The Contacts table runs Interest (pinned), then one column per form field, then Views, AI summary and AI interest, then Referrer, Stay time, and Submitted at.
The Recipients table and the all-viewers section run Interest, Share link, Views, AI summary and AI interest, Pages of interest (all-viewers only), Referrer, Stay time, Location (all-viewers only), and Last viewed.
Click a header to sort ascending or descending, and hover a cell to reveal a copy icon. Views appears only with the same-viewer toggle on, and the two AI columns only with AI interest on.
The two toggles
Section titled “The two toggles”On Contacts and Recipients they sit at the right end of the sub-tab row, each with an ⓘ. Interest changes shows neither the toggles nor the toolbar.
- Same viewer (on by default) collapses one person’s views into a single row and shows only their latest submission. See How people are grouped for the rules.
- AI interest (off by default) has no plan gate, so Starter can use it too, drawing on that plan’s monthly AI credits. It has the AI read each person’s pages of interest and reading behavior to produce an insight for outreach. It covers everyone except anonymous viewers who arrived on an open-access link. People on per-recipient links and lead capture links are included. Turning it on starts a batch run and shows a progress counter such as 3/8. The toggle is per document, it spends AI credits, and anyone already analyzed is not charged again.
Choose which columns appear — Customize columns
Section titled “Choose which columns appear — Customize columns”Click Customize columns in the toolbar, to the left of the expand button, to open the List columns panel. When a list has no rows, the toolbar is replaced by an empty state and the button isn’t there. You decide which fields appear and in what order.
- Show or hide — tick a column to show it, untick it to hide it. The last visible column can’t be turned off, because the table would be empty.
- Reorder — drag a row by the handle on its left and the table column moves with it.
- Reset to default — the button at the top right of the panel restores the original layout.
The panel opens on the contact and recipient tables and on the All visitors section in the Insights tab. Each of the three lists keeps its own layout.
Spread information-form fields into columns
Section titled “Spread information-form fields into columns”The All visitors section in the Insights tab only shows a tag for whether someone submitted their details. Turn on Show lead info columns there — it appears only on documents that have lead form fields — and every field collected through your lead form becomes its own column — including custom fields you built, such as name or company. Adding or renaming a field in the form updates the list, though a deleted field keeps its column while submitted values exist. Lead fields carry a Lead badge in the column panel — not in the table header.
Fields that used to be CSV-only
Section titled “Fields that used to be CSV-only”UTM parameters (utm_source, utm_medium, utm_campaign and so on), Completion, Device, browser and CTA clicks used to appear only in the CSV export. You can now show them in the table. They start switched off, so turn on only the ones you read.
Search and expand
Section titled “Search and expand”The search box on the left of the toolbar finds people by name, email, or field value, and it searches the full set, not the 200 drawn rows. Expand at the far right widens the table to full screen, and collapse restores it.
The Referrer column — where each person came from
Section titled “The Referrer column — where each person came from”The Referrer column tells you which site someone came through. It sits immediately before Stay time in the Contacts table, the Recipients table, and the all-viewers section.
- It shows the domain only, with
www.stripped, sohttps://www.linkedin.com/feed/becomeslinkedin.com. - With no value the cell shows
—. The filter panel labels that case Direct, the Insights Sources card buckets it under a lowercasedirect, and the home card calls it direct visits. - The column does not sort. The value shown is the referrer from the most recent view that had one, the same rule parameters use.
- With the same-viewer toggle off you see that one view’s referrer. With it on you see the person’s most recent one.
- For the full URL and the utm values, open the detail dialog or export the CSV.
The table draws 200 rows at a time
Section titled “The table draws 200 rows at a time”Tables render 200 rows at most. Below the table you see “Showing 200 of N” and Show 200 more, which adds another 200 each click.
- Sorting, search, the count badges, and CSV always run on the full set. The cap limits only what gets drawn.
- Changing tab, search text, sort, the same-viewer toggle, a filter, or the period resets the cap to 200.
- There is no “show everything” option. Drawing thousands of rows freezes the page for seconds, so download the CSV when you need the full set.
Interest grades (Hot, Warm, Cold) and how they are scored
Section titled “Interest grades (Hot, Warm, Cold) and how they are scored”FeatPaper scores reading behavior from 0 to 100 and maps it to three grades: Hot at 50 and above, Warm at 25 and above, Cold below 25. Submitting a lead form doesn’t make someone Hot on its own — the bonus only kicks in when a person who submitted comes back for another visit. It is an automatic classification from view data, not feedback anyone gives you.
| Grade | Score | Meaning |
|---|---|---|
| Hot | 50 and above | Long reads, high completion |
| Warm | 25 and above | Middling |
| Cold | Below 25 | Low interest |
The score weighs coverage, the share of pages read; depth, time spent and whether a single page was read closely; revisits, how often they came back and what they re-read; and actions, downloads and clicks on links inside the document. Someone who submitted a form and then came back earns a bonus.
The Interest changes sub-tab
Section titled “The Interest changes sub-tab”People whose grade changed recently collect in Interest changes. Each row shows an unreviewed dot, the person’s name, the transition such as Warm → Hot, and the time it changed. The ▸ on the right opens their detail. Mark all as seen at the top right clears the dots, and a short toast appears at the bottom of the screen when new changes land.
The detail dialog
Section titled “The detail dialog”Click a row to open it.
- Interest changes shows how that person’s grade moved, for example Warm to Hot.
- AI content insight is the AI summary built from their pages of interest. Without one, Generate with AI creates it for that person alone and spends credits.
- Submitted details lists the email, name, or phone number they entered.
- Documents viewed lists what they actually opened, page by page.
- Pages of interest lists the pages they read longest or most often.
- Referrer, parameters, device, browser, and location round out the dialog.
Copy AI summary and Copy AI interest copy those fields verbatim.
How people are grouped
Section titled “How people are grouped”With the same-viewer toggle on, these count as one person:
- The same email address, ignoring case and surrounding whitespace, across devices.
- The same phone number, compared digits only, so
010-1234-5678matches01012345678. - A record carrying both a signed-in account and a per-recipient link recipient.
- An anonymous view that links to exactly one confirmed identity, which is how views before a form submission get attached.
These stay separate:
- A different email or phone number always means a different person, even on the same computer and browser. This stops a stale cookie on a shared machine from merging two people.
- An anonymous view entangled with two or more identities stays as its own row.
- Anonymous views with no email and no phone number are one row per view.
The on-screen help says the same thing: views that share a session cookie or an email are merged into one group, and anonymous views with neither identifier appear as separate rows.
Integrations and CSV export — Notion, Google Sheets, Zapier
Section titled “Integrations and CSV export — Notion, Google Sheets, Zapier”On the right of the Viewers tab toolbar, Notion, Sheets, and Zapier are the integrations (Business and above) and Download N is the CSV export (Pro and above). You connect Notion and Sheets from their buttons here. Zapier is not connected here: you build a Zap with the FeatPaper app inside Zapier and pick this document, and the toolbar’s Zapier button just shows what’s connected. None of the three is set up under Settings > Connections, which only holds the Notion account link.
The buttons you use here are Notion, Sheets, Zapier, and Download N, and Expand at the far right opens the table full screen. Integrations are configured per document, one set each. There is no per-link integration.
Connect your account
First time round, connect your Notion account under Settings > Connections. Google Sheets has no account to connect: the Sheets dialog shows a service account email, you share your spreadsheet with that address as an Editor, then paste the spreadsheet URL.
Attach it to the document
Click Notion or Sheets in the toolbar and choose the target. A green check appears once it is connected, and realtime sync starts pushing new contacts.
Send what you already have
Export existing contacts pushes everything collected so far, then reports how many succeeded and failed.
Disconnect if you need to
Disconnect this document stops the sync for this document only. Your account connection stays, so other documents keep working.
The Zapier button is a read-only view of the Zaps connected to this document and the criteria they send on. The three triggers are new viewer, new recipient view, and new contact. You turn them on or off in Zapier’s own Zap editor. Zapier isn’t listed under Settings > Connections — you connect it from the Zapier side by creating a Zap with the FeatPaper app and picking this document. Until you do, the dialog says no Zaps are connected yet and offers an Open Zapier button.
Export to CSV
Section titled “Export to CSV”Choose the tab
In the Viewers tab, pick Contacts or Recipients. The all-viewers section on the Insights tab also exports.
Click Download
The Download N button in the toolbar writes a CSV file.
The CSV starts with the on-screen columns, then appends a detail block in this fixed order: Pages of interest 1/2/3, Referrer, utm_source, utm_medium, utm_campaign, utm_content, utm_term. Next come Form submitted, Interest score, Views, Total stay time, Completion, First viewed, and Last viewed. The block ends with Recipient, Access URL, Share link, Device, Browser, and Location.
- Detail-block values are always that person’s totals. A column already carrying the same total on screen is dropped to avoid duplicates.
- Two things are left out on purpose: the document name, since one file is one document and it would be a constant column, and the six interest sub-scores, since the total score covers it.
- Checkbox answers export as
YesorNoin the table, the CSV, and the integrations. Share linkis derived from the address, so a link that is not a per-recipient link falls back to the default name.
When data is missing or looks wrong
Section titled “When data is missing or looks wrong”- A couldn’t-load message on the list. A failure is reported as a failure instead of showing zero. Click Try again. Metric cards show a grey
—in place of the number, and hovering it explains that it couldn’t load. - You see another document’s data. This used to happen when you jumped straight to another document from global search or a bookmark. The screen is now rebuilt whenever the document changes.
- The last day of a range is missing. Fixed: the end date now includes that whole day.
- A new view is not on the home screen yet. The home overview is no longer cached, so new views and submissions appear immediately.
- A total looks too low. Documents with very large view histories can report that not all data could be loaded, which means the sum may undercount.
The 7-day limit on Starter (analytics retention)
Section titled “The 7-day limit on Starter (analytics retention)”| Plan | Per-person detail |
|---|---|
| Starter | 7 days after upload |
| Pro | No limit |
| Business | No limit |
| Enterprise | No limit |
- On-screen wording: “Starter shows view data for 7 days after upload. Pro opens up the full period.”
- Hidden data is flagged with notices about contacts and referrer data you have not seen. Clicking one opens the upgrade dialog.
- Sample and demo documents are exempt and always show the full period on any plan.
- Interest changes older than 7 days after upload are not shown on Starter.
Ways to use this
Section titled “Ways to use this”Chase the hot contacts first
Sort by interest in the Viewers tab and start with Hot. The Interest changes sub-tab catches anyone who just became Hot.
Find the channel that lands
Use Analytics on a Share links tab row, or All filters > Share Link and Referrer, to compare links and sources.
Swap the version, keep the link
Upload a new version from the Manage versions card on the Content tab and click Publish. Links you already sent keep working, so there is nothing to resend.
Push contacts to your CRM
Read submissions on the Contacts sub-tab, then send them to Notion, Google Sheets, or Zapier, or export CSV.
Combining features sharpens the answer. Three combinations people reach for most.
Attach a PDF to an email and there is no record that it was even opened, which leaves you asking “did you get a chance to look?”. Share a link and whether it was read, the time spent per page, repeat visits, and the referrer are all recorded — so you can decide when to reach out, and about what, without asking.
Button and shortcut reference
Section titled “Button and shortcut reference”Header
Section titled “Header”| Control | Where | What it does |
|---|---|---|
| Preview | Header, right | Opens the web viewer in a new tab through a personal link, unpublished changes included. |
| Publish | Header, right, next to Preview (only while changes are pending, in place of Copy share link) | Sends pending version, motion, and title changes to every shared link. Only people who can edit the document see it. |
| Copy share link | Header, right (accent color) | Copies your current quick link. Without one, it opens Share links. Replaced by Publish while changes are pending. |
| ▾ (Share links) | Directly right of Copy share link | Copy any link, set your quick link with the pin, and Manage share links. |
| Bookmark | Right of the title | Adds or removes the sidebar bookmark. |
| Add tag | Under the title | Tags the document, up to 20 characters. |
| More (⋮) | Header, right | Opens Share, Edit, Duplicate, Move, and Delete. |
Content tab
Section titled “Content tab”| Control | Where | What it does |
|---|---|---|
| Manage versions card | Top of the tab | Opens the version upload and management dialog, for editors. |
| Add video or link | Next to the Manage versions card | Goes to the editor, for editors. |
| Page Previews (section) | Middle of the tab | Scrolls pages horizontally, and enlarges the one you click. |
| Source file | Below the previews | Downloads the original PowerPoint, Figma, or other source. |
Insights tab
Section titled “Insights tab”| Control | Where | What it does |
|---|---|---|
| 7 Days / 30 Days / All | Filter bar | Changes the period (All by default), and is locked on Starter. |
| Last 7 Days / Last 30 Days / All / Custom range | Period row of the All filters panel | The panel spells the presets out in full, and Custom range sets an exact start and end date. |
| Sharer, Version | Filter bar | Narrows the data to one member or version — Sharer appears for the owner and editors only, and neither is cleared by Reset Filters. |
| All filters | Filter bar | Opens the ten-axis filter panel. |
| Reset Filters | Filter panel or filter bar | Clears every axis except Sharer and Version. |
| Refresh | Filter bar | Reloads the latest data. |
| Card dropdown | Devices card | Switches between Device, Browser, and OS. |
| Card dropdown | Sources card | Switches between Referrer, utm_source, utm_medium, utm_campaign, utm_content, and utm_term. |
| Card dropdown | Region card | Switches between Countries and Cities. |
| Card dropdown | Top viewer card | Switches the ranking basis, such as Views. |
Viewers tab
Section titled “Viewers tab”| Control | Where | What it does |
|---|---|---|
| Sub-tabs | Top of the list | Switches between Contacts, Recipients, and Interest changes (Contacts by default). |
| Same viewer | Right of the sub-tab row | Collapses one person’s views into one row, on by default. |
| AI interest | Right of the sub-tab row | Batch-analyzes eligible people (off by default, set per document, and spends credits). |
| Mark all as seen | Interest changes, top right | Clears the unreviewed dots. |
| Search box | Toolbar, left | Finds people by name, email, or field value, across the full set. |
| Notion, Sheets, Zapier | Toolbar, right | Attaches a document-level integration or reads its status (Business and above). |
| Download N | Toolbar, right | Exports the list as CSV (Pro and above). |
| Customize columns | Left of the expand button | Choose which columns appear and in what order. |
| Expand | Toolbar, far right | Widens the table to full screen. |
| Show 200 more | Below the table | Renders another 200 rows. |
| Generate with AI | Detail dialog | Analyzes that one person and spends credits. |
| Copy AI summary, Copy AI interest | Detail dialog | Copies those fields to the clipboard. |
Shortcut: Open My Documents
Frequently asked questions
Section titled “Frequently asked questions”Where did the all-viewers list go?
It moved to the bottom of the Insights tab. The Viewers tab now has three sub-tabs only: Contacts, Recipients, and Interest changes. Saved ?tab=leadform&vtab=all URLs redirect to Insights. To see everyone with no conditions, clear the Insights filters and scroll to that section, or click the tab link in its subtitle.
Why does the Viewers tab open on Contacts?
Contacts is the default sub-tab. To land elsewhere, add ?tab=leadform&vtab=subLink for Recipients or ?tab=leadform&vtab=changes for Interest changes.
My Performance tab is gone.
Performance was renamed Insights and rebuilt. Views, the viewer count, and completion are all still there, the filters grew to ten axes, and the all-viewers list was added at the bottom.
My lead form tab is missing. Where do submissions go?
The standalone tab was folded into Viewers. People who submitted the form appear on the Contacts sub-tab, and you build or edit the form itself in the editor, which you reach from the lead capture link’s share settings (Lead form settings › Open) on the Share links tab, or from the Lead form settings button on an empty Contacts sub-tab. See Set up a lead form.
Views and the viewer count disagree. Which one is right?
Both. Views counts how many times the document was opened, and the viewer count counts how many people opened it. One person opening three times gives Views 3 and a viewer count of 1. Average Completion and Average Stay Time average across views, not people, so a frequent viewer weighs in several times.
Why does the Referrer column show only a domain?
That is intentional: the table shows the domain with www. stripped. For the full URL and utm values, open the detail dialog or export the CSV, where Referrer and utm_source through utm_term are separate columns. With no value you see — in the table and Direct in the filter.
Why can't I sort by referrer?
The Referrer column does not support sorting. To isolate one source, use All filters > Referrer on the Insights tab.
Only 200 rows show up. How do I see the rest?
Tables draw 200 rows at a time for speed. Show 200 more adds another 200, and “Showing 200 of N” tells you the real total. Sorting, search, counts, and CSV always use the full set, so no number is wrong. For everything at once, export the CSV.
How do I export the viewer list to CSV?
Open the Viewers tab, pick Contacts or Recipients, and click Download N in the toolbar. The all-viewers section on the Insights tab exports too, with one difference in scope: the Viewers tab CSV ignores the Insights filters (a share-link filter or search term still narrows it), while the Insights section CSV applies them. CSV export requires Pro or above.
Slack no longer appears in the integration menu.
Document-level Slack sync was removed. Slack cannot update a message it already posted, so an interest-grade change would arrive as a duplicate, which is unsuitable for storing data. The document-level channels are Notion, Google Sheets, and Zapier. Slack notifications for new views are unaffected; set them up per account under Settings > Connections.
I connected an integration but the green check only shows on Contacts.
That is expected. Contacts and Recipients are separate connections, so if you only connected on Contacts, Recipients shows no check. To send people who opened per-recipient links as well, connect again from the Recipients sub-tab with the same button.
CSV export is blocked for me.
CSV export requires Pro or above. On Starter you can keep reading everything on screen but cannot write a file. Notion, Google Sheets, and Zapier integrations require Business or above.
Do I need Business to download contacts as CSV?
No. Downloading your contacts or recipients with Download N in the Viewers toolbar is Pro and above. The one CSV that needs Business is the per-recipient link list from Create in bulk from an email list on the Share links tab. The names sound alike, but they are separate features.
Where do I set up Zapier: the Zapier button on the Viewers tab, or Settings > Connections?
Neither. You set it up in Zapier: create a Zap with the FeatPaper app and choose this document. The Zapier button in the Viewers toolbar is a status view of the Zaps connected to this document and their triggers (New viewer, New recipient view, New contact), and you switch Zaps on or off in Zapier’s editor. Zapier does not appear under Settings > Connections. Zapier, Notion, and Google Sheets integrations need Business or above.
What is the same-viewer grouping?
It collapses one person’s views into a single row, on by default. The same email, ignoring case and whitespace, or the same phone number, digits only, is one person across devices, and only their latest submission is shown. Turn it off and each view becomes its own row. A different email or phone number is never merged, even on the same computer.
If the same person opens on a laptop and a phone, is that two people?
Not if they are identified. The same email or phone number counts as one person across devices. Anonymous views with neither identifier stay separate per device and browser. And a different email or phone number is never merged, even on the same computer, which stops a stale cookie on a shared machine from merging two people.
How is the interest grade calculated?
Coverage, reading depth, revisits, and actions such as downloads and in-document link clicks produce a 0 to 100 score. 50 and above is Hot, 25 and above is Warm, and below that is Cold. It uses the person’s entire history and recalculates on every visit.
Where do I see who changed interest grade?
The Interest changes sub-tab collects them. A blue badge marks changes you have not reviewed, and a short toast appears when new ones land. Mark all as seen at the top right clears the dots, and ?tab=leadform&vtab=changes opens the sub-tab directly.
They filled out the form, so why are they still Cold?
That’s expected — a form submission alone won’t make anyone Hot. The grade comes from reading activity (coverage, depth, revisits, downloads and link clicks): 50 and above is Hot, 25 and above is Warm, anything lower is Cold. Someone who submits and then barely reads can land on Cold. If they come back for another visit, the submission adds a bonus.
When does the Viewing badge go away?
It becomes the final interest grade once the person stops reading. If the browser closes without an end signal, the status is re-evaluated every 30 seconds, so it will not stay stuck. Viewing is judged across the whole document, not per link.
Can I use AI interest on the free Starter plan? Will it keep eating credits if I leave it on?
Yes, you can turn it on. AI interest has no plan gate, and Starter pays for it from its monthly AI credits. Credits are spent only on new analysis: anyone already analyzed is not charged again, and the automatic refresh after a grade change is free too, so leaving the toggle on doesn’t drain your balance. If credits run out, only the analysis pauses; the Hot, Warm, Cold grade keeps showing for free. Check your balance in AI credits and usage.
Does turning on AI interest cost credits?
Yes. Switching it on starts a batch analysis that spends AI credits. It covers everyone except anonymous viewers on an open-access link; per-recipient and lead capture link viewers are included. Anyone already analyzed is not charged again (grade-change refreshes are free as well); credits go to a person’s first analysis and to re-analysis after a new document version. The toggle is per document, and the Hot, Warm, Cold grade itself is always free.
Turning on AI interest takes a while.
Flipping it on analyzes everyone eligible in one batch, which can take a few minutes depending on how many pages the document has. A progress counter such as 3/8 tracks the run, and when it finishes each detail dialog carries an AI content insight. With nobody new to analyze, the dialog says so.
Do my own views show up in the numbers?
Yes. Right now your own views are counted like anyone else’s, whether you’re signed in or using a private window. To leave test views out, register your office IP under Analytics Exclusion — views recorded after you save are excluded.
I get a couldn't-load error on the list.
The data did not load. This used to appear as “0 results”, which was misleading. Now the failure is explicit and a Try again button is offered. If it keeps happening, refresh the page or retry shortly.
If I swap in a new version, does it break links I already sent?
No. Uploading a new version from the Manage versions card on the Content tab keeps every link you already shared. Click Publish at the top right, and anyone reopening the old link sees the new version, so there is nothing to resend. Contact counts are keyed to the original document and are not reset either.
On Starter, is data deleted after 7 days?
No. Starter limits reading per-person detail to 7 days after upload; after that the counts stay and the detail is hidden. Upgrading to Pro or above makes the older data readable again. Sample and demo documents always show the full period.
Our reps each send the same deck. Can I see whose link each read came through?
Yes — pick a member in the Sharer filter on the Insights filter bar, and you’ll see only the data from links that member shared. It works on every plan, and the filter shows up when you’re viewing the document as its owner or with can edit. Each rep just sends the link they copy from the Share links tab in their own account — no need to make a separate per-recipient link for each of them.
How do I see only the people who came through one link?
On the Share links tab, click Analytics on that link’s row and Insights opens with the link filter applied. Or choose it under All filters > Share Link. The Insights and Viewers tabs share the same link filter.
Key points
Section titled “Key points”- View data lives in two tabs: Insights for document-wide metrics, filters, and charts, and Viewers for per-person lists.
- The Viewers sub-tabs are Contacts, Recipients, and Interest changes, opening on Contacts. The all-viewers list is the last section of the Insights tab.
- Views counts openings and the viewer count counts people. Completion and stay time average across views, so revisits weigh in more than once.
- Referrer sits before Stay time, shows the domain only, and does not sort.
- Tables draw 200 rows at a time and grow with Show 200 more. Sorting, search, counts, and CSV always use the full set.
- Document-level integrations are Notion, Google Sheets, and Zapier, Business and above. Slack is account-level notifications only, and CSV export needs Pro or above.
- Starter reads per-person detail for 7 days after upload, and no data is deleted.
Learn more
Section titled “Learn more”Set up a lead form
Collect an email or phone number before the document opens and turn anonymous viewers into contacts.
Share with a link
Open-access links, lead capture links, and per-recipient links, plus per-link settings.
AI Analytics
How AI summaries and AI interest are generated, and what they cost in credits.
Connections
Manage Slack view notifications and your Notion account connection.